Today, we will take you to look at the strain stress curve from a different perspective. This article has no formulas, no difficult sentences or complicated theories, only easy-to-understand explanations and examples. If you are a beginner, then you can easily understand the strain stress curve; if you are an expert, this article is likely to bring you more new ideas. Let’s get started below!
What is a stress-strain curve?
Imagine that you pull a rubber band: at the beginning of the pull, it can be easily stretched, let go and return to its original state; if you continue to pull it hard, to a certain extent, it will be “snap” a break – this deformation process is condensed into a scientists Stress-strain curve.

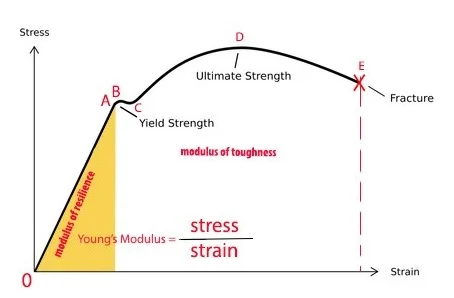
Let’s take a brief look at the stress-strain graph, where the horizontal coordinate is the strain (the ratio of the amount of deformation of the material to its original length), and the vertical coordinate is the stress (the amount of tensile force per unit area).
Just as an electrocardiogram reflects the activity of the heart, a stress-strain diagram reflects the activity of the molecules inside a material, and tells us when a material is “strong and resistant” and when it is “surrendering”. For example, steel has a long, flat curve, while glass has a short, steep curve, which is why steel is more resistant to impact and glass is more fragile.
The four major stages of the stress-strain curve
Take a wire stretching experiment for example, it goes through the following 4 stages before it is pulled off:
Elastic phase (OA section): like pulling a spring, it will recover completely after the external force disappears. At this time, the atomic spacing is fine-tuned, and the material “memory” is intact.
Yield phase (near point B): The metal suddenly “softens” and the stress fluctuations may even decrease. The atomic layers begin to move, which results in a permanent deformation (an elongated wire cannot be retracted).
Reinforcement Phase (Segment BC): In this phase, the material becomes harder and requires greater tensile force to continue deforming. Atomic movement is blocked, similar to a vehicle detour in a traffic jam.
Neck shrinkage stage (after point C): as the tension increases, the wire locally begins to thin (such as Play-Doh stretched thin in the middle), and eventually breaks. At this point, the material is full of holes inside.

Here’s some key data from the strain-stress curve: the slope of the elastic phase = modulus of elasticity (material stiffness), stress at the highest point = tensile strength, and strain at the point of rupture = ductility.
How to draw a stress-strain curve

For unknown materials, we can’t plot it manually, this is because we can’t even pull the material to the yield stage if we use our hands. The equipment we commonly use is a universal testing machine, where we clamp a sample of the material and stretch it at a fixed speed to get a graph.
Here are 3 error-prone details to keep in mind when testing:
1. Sample size must be standardized (too long to measure the strain, too wide to break early);
2. Stretching too fast will lead to the curve “false high” (the material can not deform in time), keep a uniform stretching speed;
3. For the same material, a temperature fluctuation of 1°C may make a big difference in the plastic curve, and it is better to be in a constant temperature environment.
How the curves differ for different materials
Metals (e.g. mild steel): it has a curve with a pronounced yield plateau, high ductility (strain before fracture > 20%) and is suitable for automotive crash beams.
Plastics (e.g. polyethylene): the elastic phase is short, the whole curve is “S” shaped, and is strongly influenced by temperature (plastic pots are more brittle in winter).
Ceramics: steep, straight and short curves, almost no plastic deformation (strain <1%), but very high modulus of elasticity, suitable for cutting tools.

Cold knowledge: The rubber band curve is very special – stretching the initial period instead of softening (molecular chain stretching), late sharp hardening (molecular chain straightening), this phenomenon is called entropic elasticity.
What factors affect the shape of the curve
Temperature: ice is hard as a rock at -20°C and crumbles in a pinch at 0°C – low temperatures inhibit atomic motion, making the material hard but more brittle.
Stretching speed: If you pull the playdough slowly it will stretch very long, if you pull it fast it will break easily.
Internal defects: a single 0.1mm impurity may reduce the strength of the alloy by 30% (refer to the Titanic rivet sulphide defect incident), which makes ultrasonic flaw detection very important.
How do you use stress-strain curves to solve real-world problems?
Depending on the environment of use, choosing the right material is important for your project to avoid danger and unnecessary troubles. Here we briefly talk about how we should utilize the stress-strain curve when facing practical problems.
Material selection: Propellers for ships require high yield strength (high point B of the curve), while some rubber products require high ductility (long horizontal coordinate of the curve).
Determine the safety factor: bridge design loads are usually taken as 1/3 of the yield strength of the material to prevent sudden failure.
Determining the cause of failure: If the stress curve of the fractured part does not have a yield phase, the material may have been improperly heat treated (made brittle).
A classic case: the collapse of the Samho department store in Seoul, Korea, in 1981, in which abnormal stress-strain curves in steel reinforcement revealed jerry-building.
Some complex stress states
When we use or make metals, they are subjected to many forces, even if we can’t see them. These loads are: Compression, Tension, Shear, Torsion and Bending.
Fatigue curves: Railroad tracks are subjected to sub-stress cycles every day and can suddenly break even if the maximum stress is well below the tensile strength (cf. catastrophes caused by metal fatigue).
Anisotropy: e.g., the transverse tensile strength of a carbon fibre composite maybe 80% lower than the longitudinal direction (similar to wood with a smooth grain vs. a transverse grain).
Complex stresses: Realistic materials are often subjected to tensile, compressive, and shear forces at the same time (e.g., bearing balls) and need to be described in a three-dimensional stress space.
Summarize
Seeing this, I believe you have fully understood the stress curve, when you see this curve again someday, you will find that this is not only the cold data on the coordinate axis but also like the material is telling you its life, from the elastic stage slowly getting longer, to the yield stage of the permanent deformation, to the strengthening stage of the growth of the adversity, until the final fracture, the end of its life.